News
19.03.26
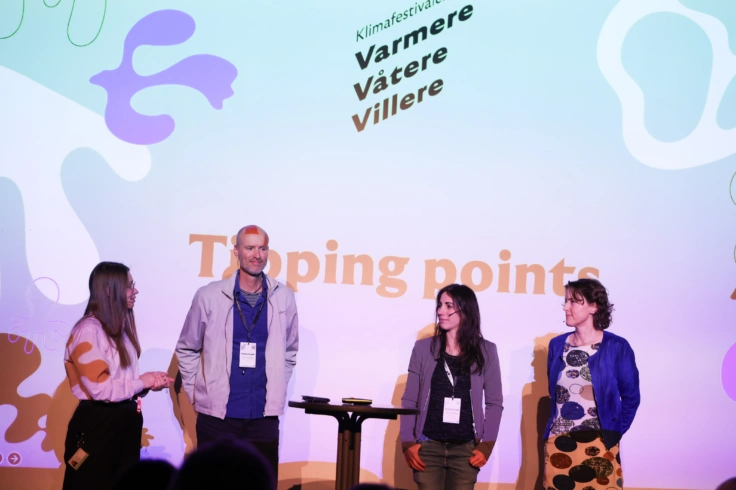
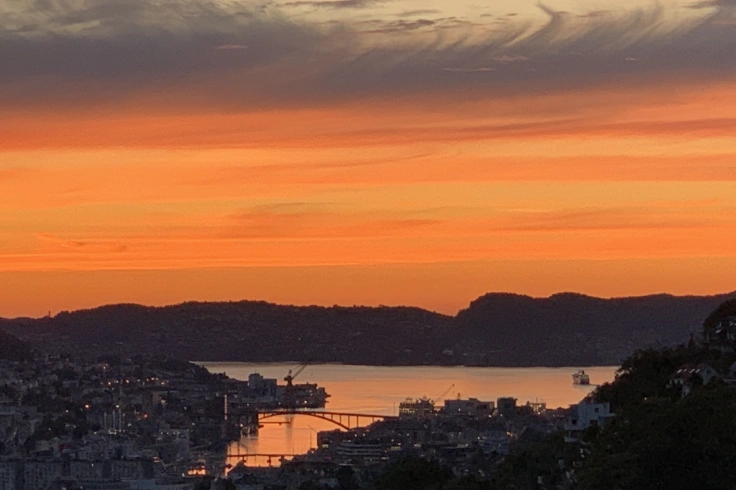
Klimafestivalen Varmere Våtere Villere i bilder
Det var mange Bjerknes-forskere i sving under klimafestivalen. Her er noen høydepunkter fra tre dager i Skostredet i Bergen.

18.03.26
10,000 years of avalanches
At the bottom of a small lake in Hardanger, lies 10,000 years of avalanche history buried. Now, scientists at the Bjerknes Centre and the University of Bergen, has uncovered one of the longest, coherent avalanche records in the world.
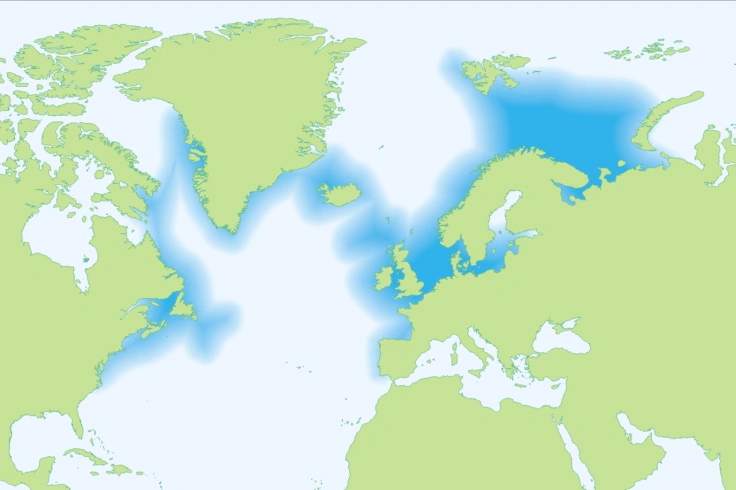
03.03.26
A brighter future may not suit everyone
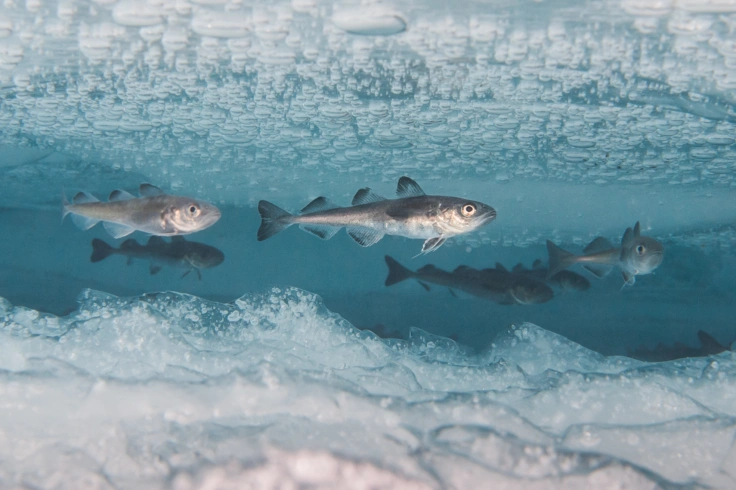
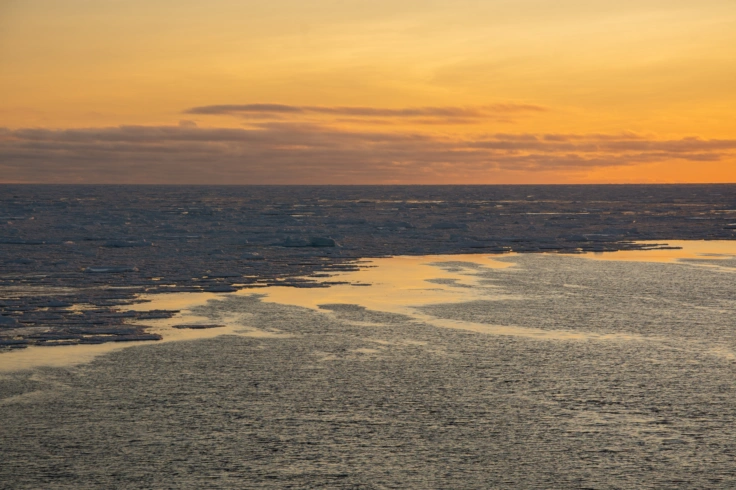
As Arctic sea ice surrenders to open water, the polar buffet expands. For polar fish the times may still be lean. Serving hours fall out of sync with their appetite.
Tags: Polar, fish, light, radiation
16.02.26
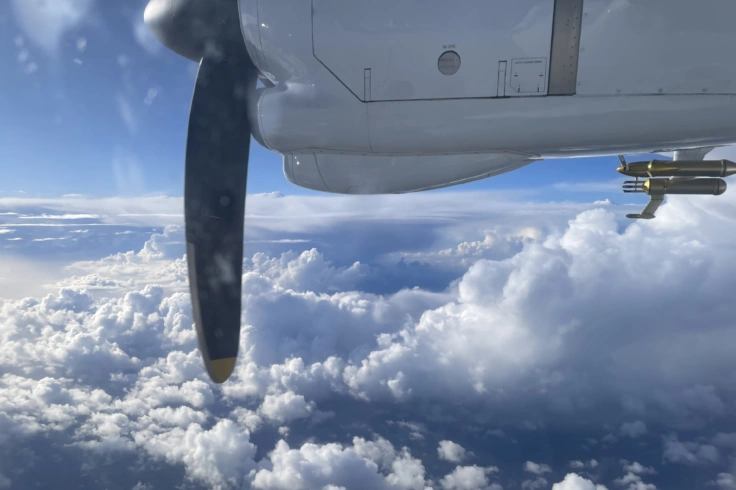
Riding the storm
A large-scale flight campaign on both sides of the Atlantic Ocean aims to uncover why some extratropical cyclones develop into storms, while others fizzle out.
Tags: Global Climate, isotope, cyclone, weather
12.02.26
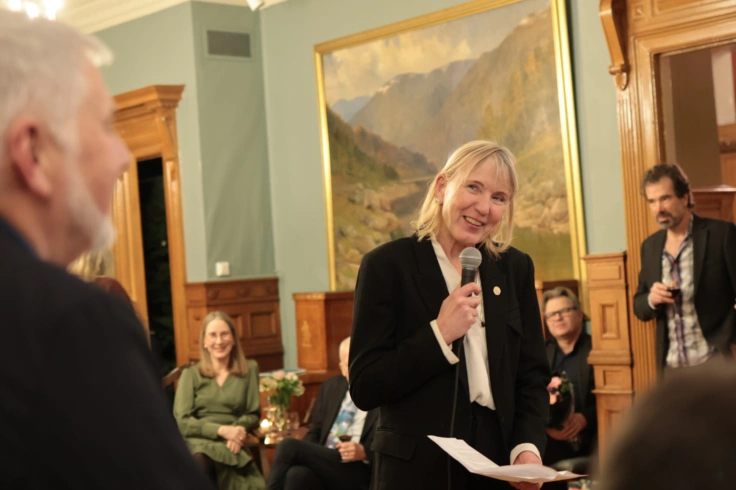
An evening in honor of Prof. Eystein Jansen
"In the spirit of Eystein, it will be a gathering that emphasizes relationships, intellectual exchange, and the path forward, and is intended as a celebration of a vibrant research community", Director Kikki Kleiven introduced the festive seminar in honor of Eystein Jansen..
10.02.26
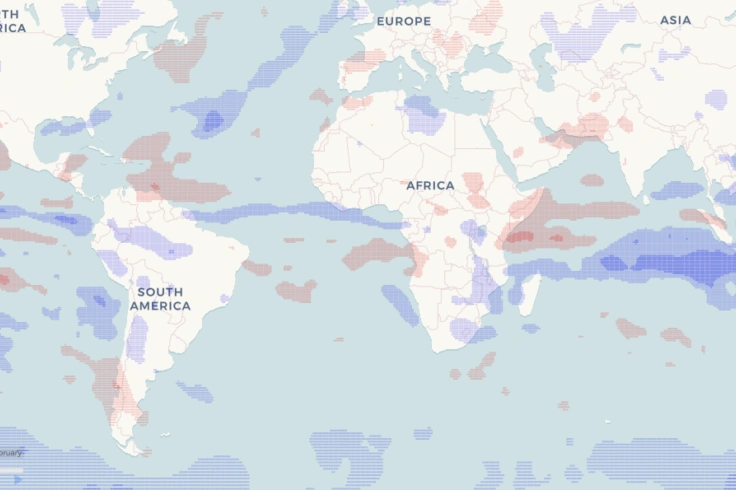
Multi-model isotope simulations reveal a unified picture of Earth’s water cycle
An international research team has completed the first fully standardized comparison of isotope-enabled climate models, demonstrating that a multi-model ensemble provides the most accurate representation of the present-day global water cycle.

05.02.26
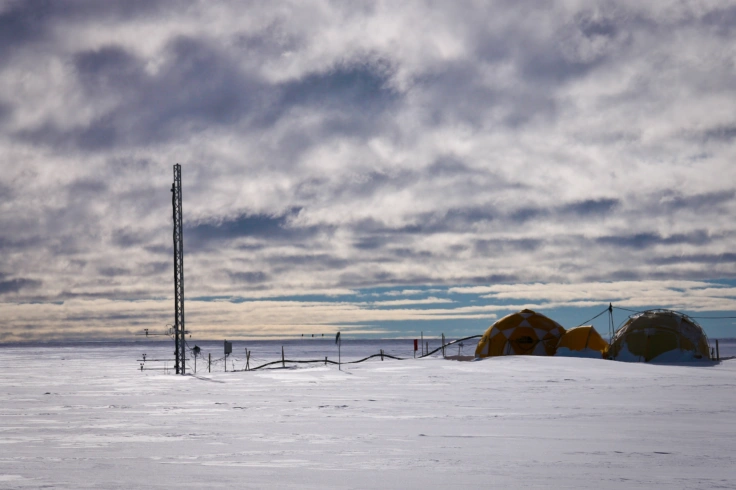
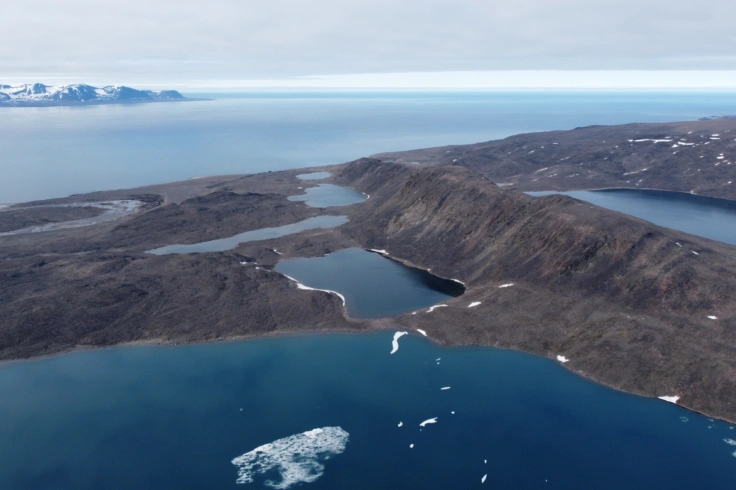
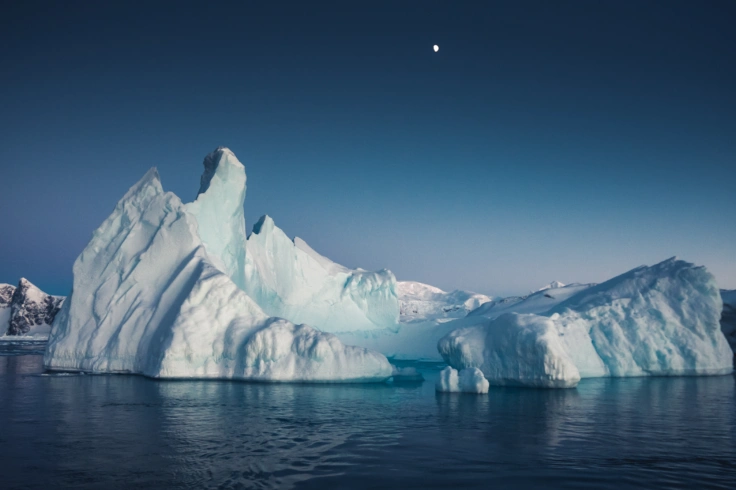
Arctic Ocean 2050
When the summer sea ice in the Arctic Ocean disappears over the next 25 years, the Arctic will be changed forever. To understand what this means for us, the Arctic Ocean 2050 research program will start in 2026.
13.01.26
Cities are essential for climate
The majority of the world's population lives in cities. Providing cities with solutions to handle climate change improves both the global environment and local living conditions.
Tags: Global Climate
29.12.25
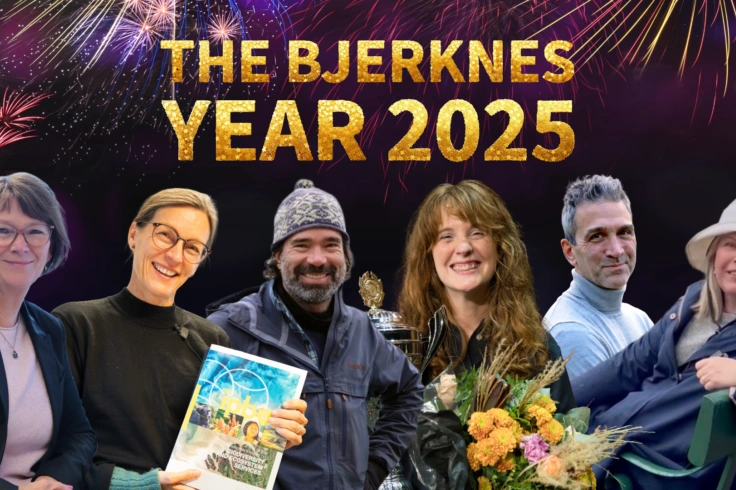
The Bjerknes Year 2025
A new year stands at the doorstep. While we wait for all things new, lets take a moment to look back at the year that was.
18.12.25
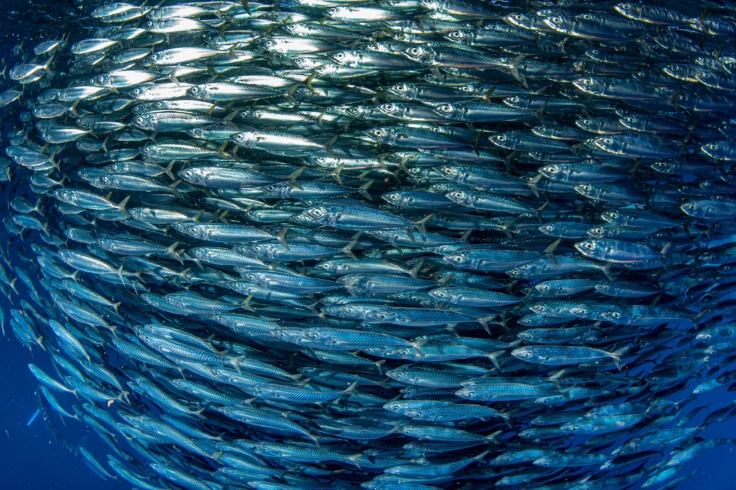
When Pacific Weather Shakes Atlantic Fisheries
How El Niño and La Niña reach across the globe to impact fish populations thousands of kilometres away
09.12.25
The cod has followed the thermometer
In recent decades the cod stock in the Barents Sea has gone up and down with the ocean temperature. Future development depends on more than the water.
Tags: Polar, sea ice, Barents Sea, fish
09.12.25
Looking at freshwater in a new way
Freshwater is quietly reshaping the oceans — and with it, the climate. A new study has looked at how rain, river runoff, and melting sea ice spread through the world’s oceans, revealing differences between the Arctic and Antarctic.
25.11.25
All the water we cannot see
Only a fraction of the ocean lies at the surface. How can we find out what happens in water that lies underwater?
13.11.25
Another record year for fossil fuel emissions
Global CO₂ emissions from fossil fuels are projected to be 1.1 % higher in 2025. The ocean CO₂ uptake was re-evaluated based on stronger evidence and new understanding.
03.11.25
Banned gases reveal the age of water
The use of gases that deplete the ozone layer has been restricted for almost forty years. Still such substances linger in the ocean – a troublesome legacy marine scientists can exploit to keep track of the ocean circulation.
Tags: AMOC
29.10.25
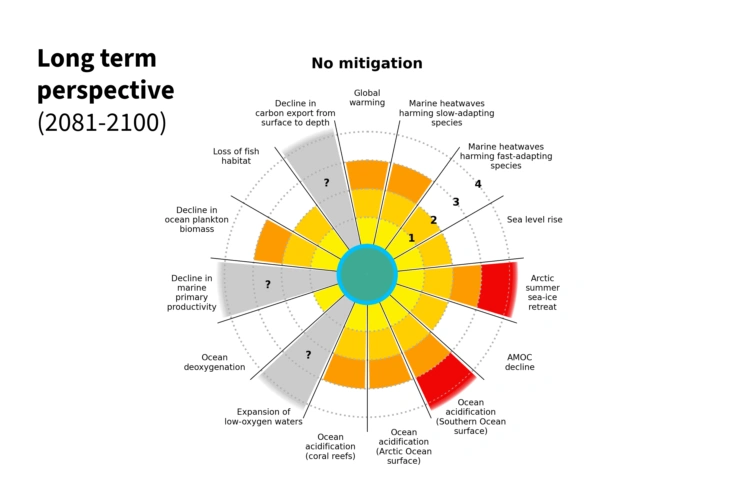
Mapping the comfort zone of ocean life
What is the safe operating space of marine ecosystems? In a new paper, Timothée Bourgeois and colleagues investigate the limits of marine ecosystems to preserve of biodiversity, food security, biodiversity and risk for human societies.
Tags: Carbon
27.10.25
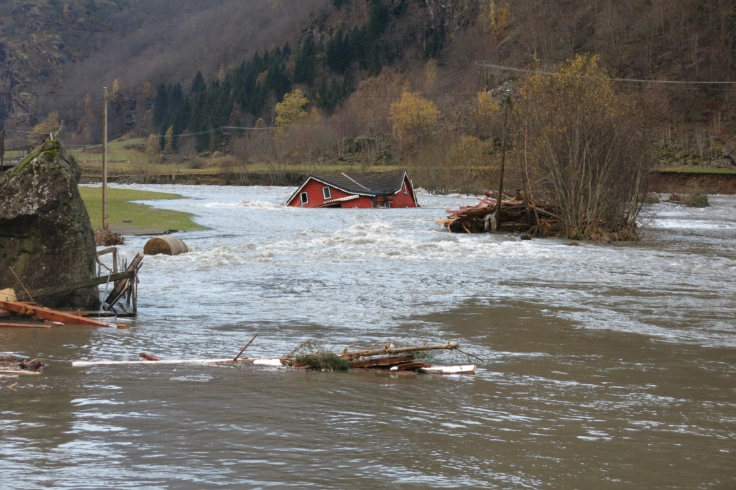
Future climate in Norway: More floods, droughts, and less snow
The climate in Norway has already undergone significant changes, and the effects are set to intensify in the coming years. This is demonstrated by a new report from the Norwegian Centre for Climate Services (NCCS).
21.10.25
How can we tell temperatures from thousands of years ago?
Sher-Rine Kong has been studying a lake in Svalbard, and her findings suggest that temperatures during the Early Holocene - around 11,700 years ago - were up to 3.5 °C warmer than today. But how can they know what the lake temperature was back then?
13.10.25
Two Systems, One Critical Challenge
The new Global Tipping Point Report is out and warns of potential risks to the Atlantic Ocean Circulation – however, there are large uncertainties about when, or if, the tipping points will be crossed.
30.09.25
Bringing Climate Models to Everyone
How AI is making complex data understandable