Can we use ocean temperatures in the Arctic to predict temperatures in Europe?
This question was investigated in a new paper by Erik Kolstad and Marius Årthun in Journal of Climate. The answer is: yes and no. It worked quite well when we used data from the period starting in 1979 (when important weather satellites were launched). But when we used data from earlier in the twentieth century, the relationships that have been valid in recent decades broke down.
An example that we investigated in some detail was central England temperature (CET), for which the observations stretch back to the 17th century. When we used data starting in 1979, we found the following relationship with sea surface temperatures (SSTs) in the Atlantic part of the Arctic:
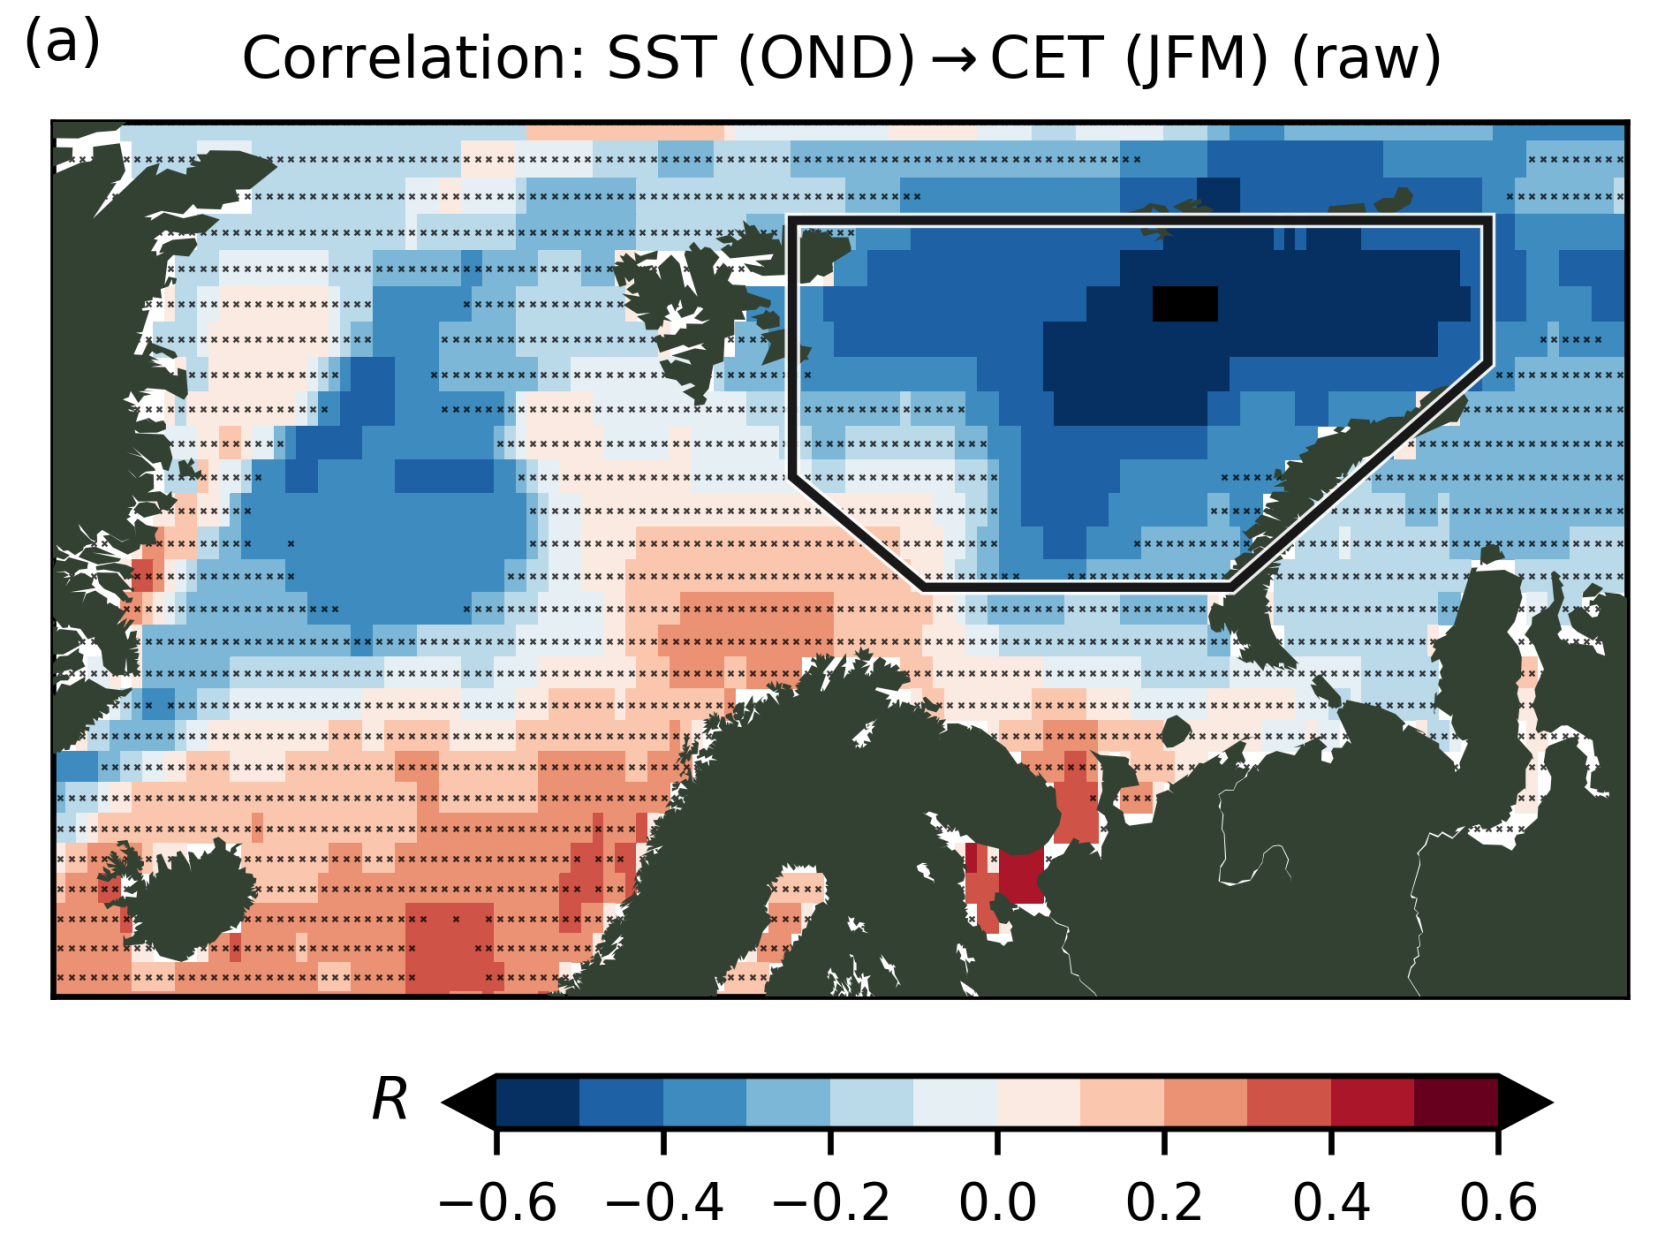
The relationship is clearly strongest in the Barents Sea, which is marked with black lines in the picture. When we averaged the SSTs inside that region and created a time series, we could compare it to the CET time series:
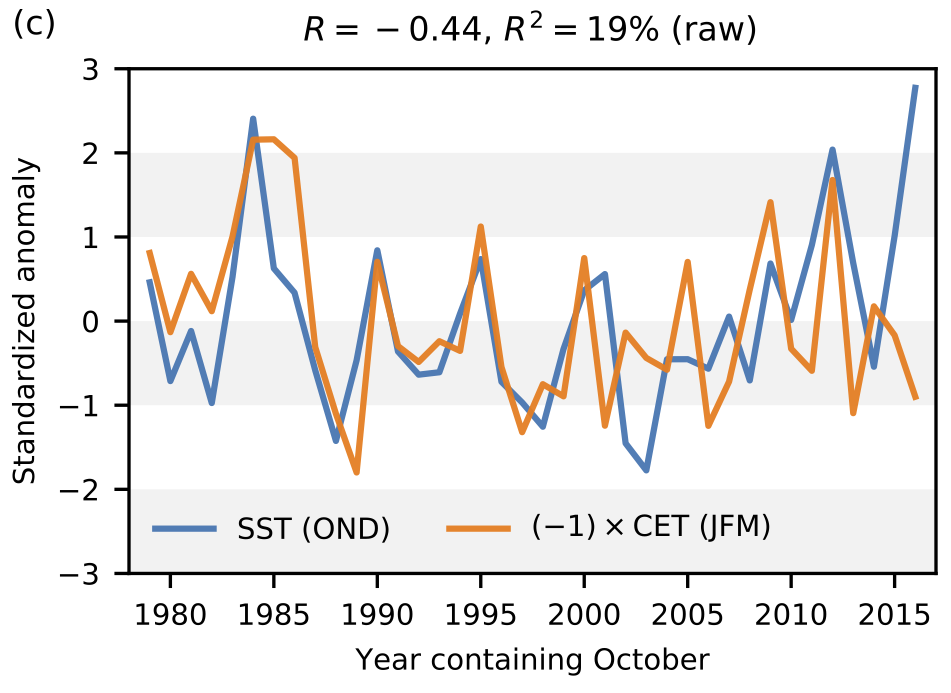
The correlation between the two time series is –0.44 for the period starting in 1979. But we were interested in what happened during periods starting earlier than 1979. Then we had to use a different data set for the SSTs (CERA-20C, while we used ERA-Interim for the recent period). What we did was to investigate all possible periods with the same length as 1979–2017, starting with 1901–1939. For each period, we computed the correlation between SSTs in the Barents Sea and CET, and found this:
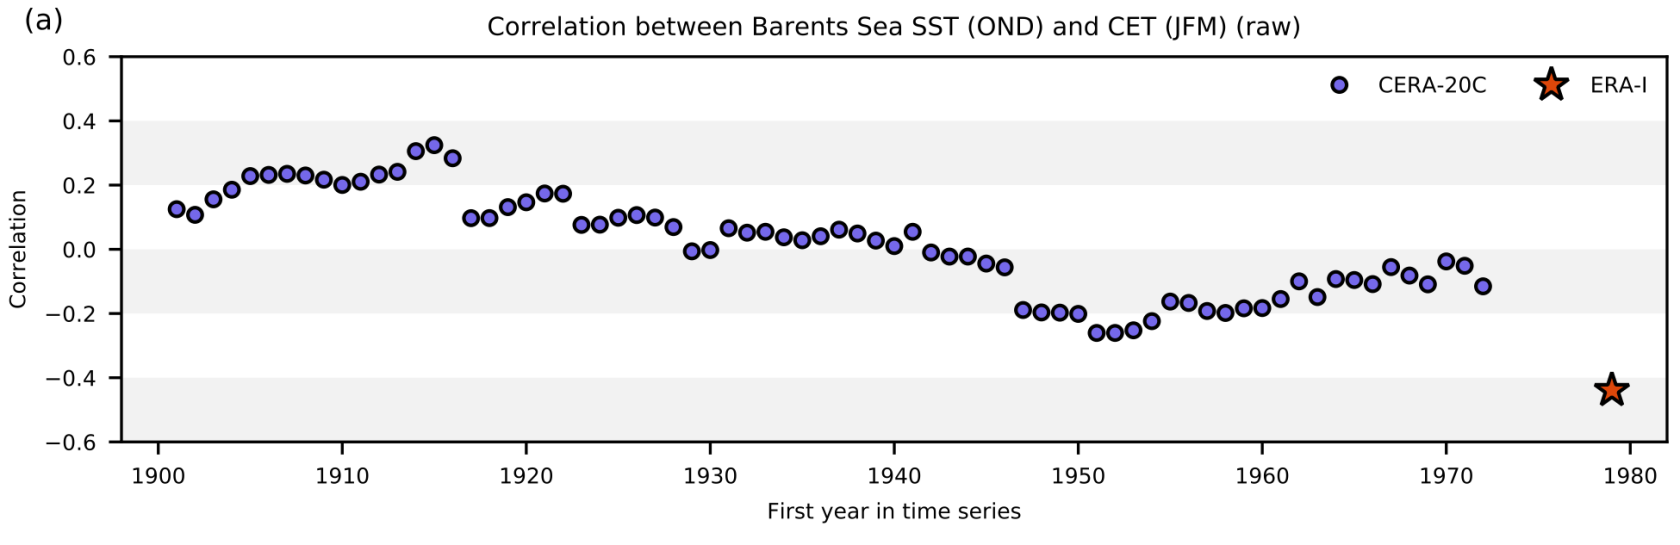
The recent negative correlation of –0.44 is unprecedented. For periods starting early in the twentieth century the correlations are even positive. One of our main conclusions is that one should take great care when using sea surface temperatures (SSTs) to predict climate in later months.
There is also a Kudos web page about this article.
Erik Kolstad is currently investigating the relationship between Arctic sea ice and the North Atlantic Oscillation.